Overview
I built my home lab to move beyond coursework and gain practical experience operating real systems. It gives me a controlled environment where I can deploy services, configure networks, troubleshoot problems, monitor system health, automate recurring tasks, and test security controls.
The lab is centered around a physical Ubuntu Server running Docker services for monitoring, infrastructure management, DNS filtering, media hosting, and system visibility. I also integrate the environment with AWS for centralized logging and Cloud Operations practice.
Lab Architecture
The environment combines local infrastructure, containerized services, custom monitoring, secure remote access, and AWS logging. This architecture gives me experience working across Linux, networking, containers, security, automation, and cloud services in one environment.
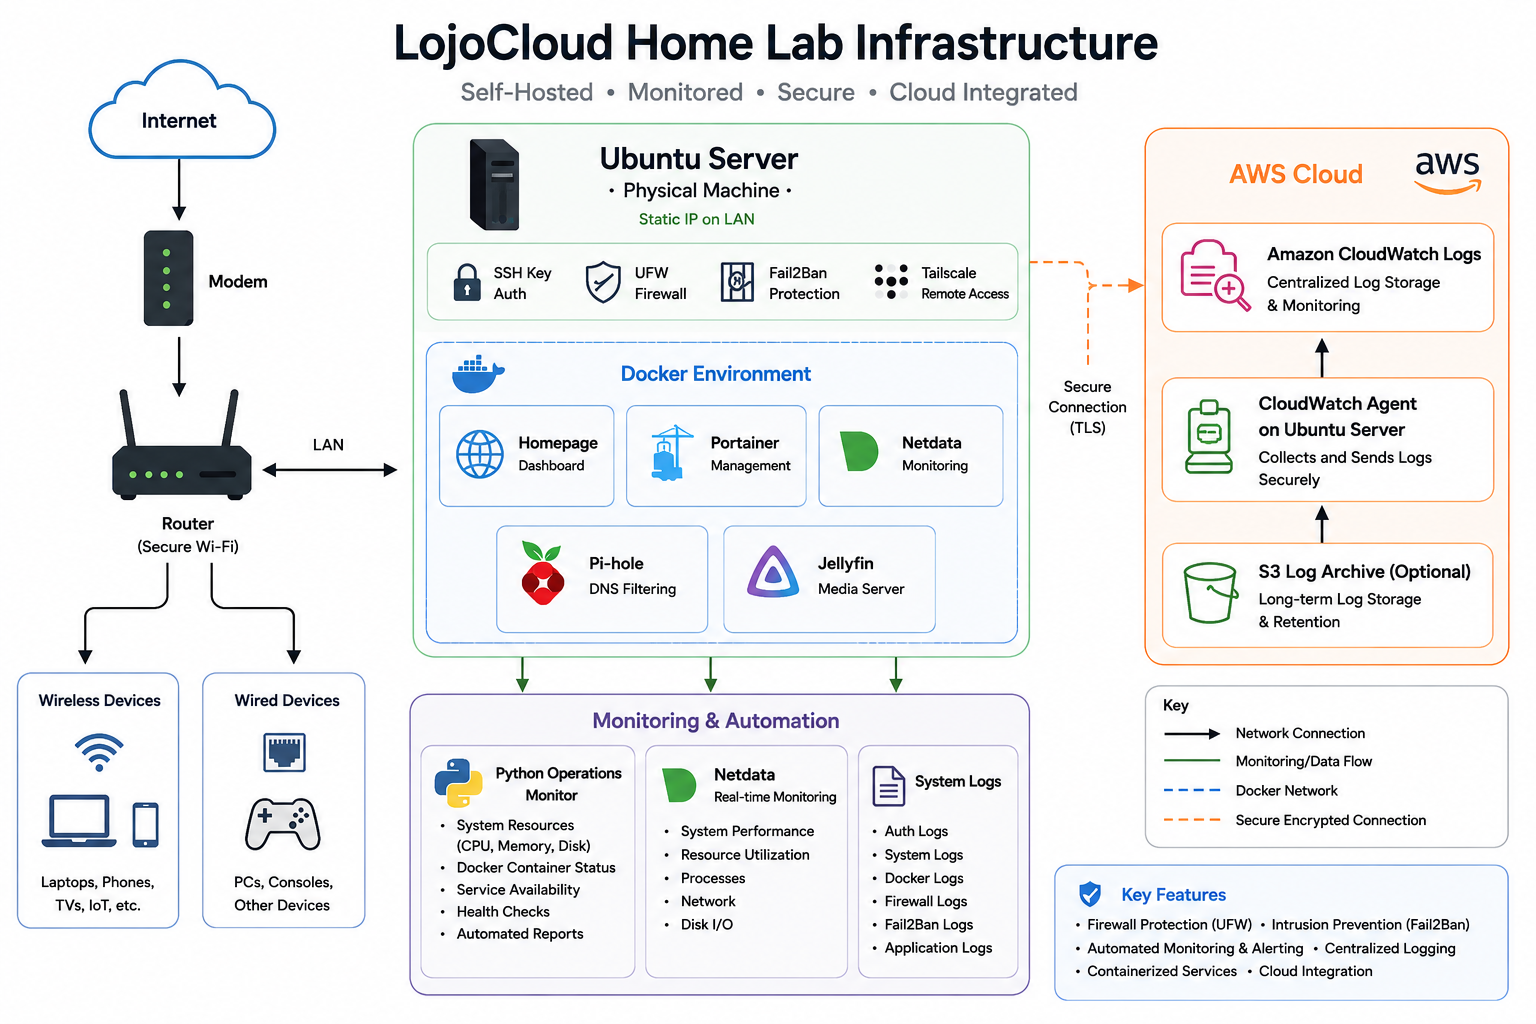
Home lab architecture showing the Ubuntu server, Docker services, monitoring tools, local network, security controls, and AWS CloudWatch integration.
Infrastructure & Security
- Built a dedicated Ubuntu Server using repurposed physical hardware.
- Configured local network connectivity and a static IP for reliable server access.
- Implemented SSH key authentication for secure remote administration.
- Configured UFW firewall rules to limit unnecessary network exposure.
- Installed and configured Fail2Ban to monitor and block suspicious authentication attempts.
- Implemented Tailscale for encrypted remote access to the lab.
- Perform ongoing Linux administration, updates, service management, permissions troubleshooting, and network troubleshooting.
Docker Environment
Docker allows me to run and manage multiple services on one physical server while keeping each application isolated and easier to maintain. Docker Compose is used to define and manage the environment.
- Homepage — Central dashboard for lab services and infrastructure visibility.
- Portainer — Web-based management and visibility for Docker containers.
- Netdata — Detailed real-time system and infrastructure monitoring.
- Pi-hole — Network-wide DNS filtering and visibility into DNS activity.
- Jellyfin — Self-hosted media server used to gain additional experience operating containerized applications.
Portable Lab Environment
In addition to my physical home server, I built a portable lab on my Windows laptop using WSL2 Ubuntu. The goal is to have a second environment where I can practice Linux, containers, automation, Infrastructure as Code, and AWS deployment without depending on access to my home server.
Containerized Application Environment
I used Docker and Docker Compose to build a multi-container application environment and practice how individual services communicate, persist data, and recover from failures.
- Deployed a multi-container environment using Docker Compose.
- Configured Flask, PostgreSQL, and Nginx as separate containerized services.
- Configured Docker networking and persistent storage between application components.
- Worked with service dependencies and container health checks.
- Tested service failures and recovery to practice container troubleshooting.
Terraform & Infrastructure as Code
I expanded the portable lab with Terraform to practice managing AWS infrastructure through code rather than relying entirely on manual configuration in the AWS Console.
- Installed and configured Terraform and the AWS CLI within WSL2 Ubuntu.
-
Practiced the Terraform workflow using
init,fmt,validate,plan, andapply. - Used Terraform to provision AWS networking resources including a VPC, subnets, Internet Gateway, route tables, routes, and subnet associations.
- Implemented Terraform variables and resource references instead of relying on hard-coded infrastructure values.
- Practiced Terraform state management and configuration drift detection.
- Configured an Amazon S3 remote backend for Terraform state and verified remote state storage.
- Reviewed Terraform plans before deployment to understand which resources would be added, changed, or destroyed.
- Troubleshot AWS authentication and IAM permissions while deploying infrastructure from the portable lab.
- Configured Git protections to prevent Terraform state, plan files, local Terraform files, and credentials from being committed to source control.
Technologies Used
WSL2 • Ubuntu • Docker • Docker Compose • Flask • PostgreSQL • Nginx • Terraform • AWS CLI • AWS VPC • Amazon S3 • IAM • Git
Monitoring & Automation
Monitoring has become one of the main areas of focus in my lab. Instead of only deploying applications, I want to understand how the environment behaves when it is running and how to identify problems before they become larger outages.
- Integrated Linux system logs with Amazon CloudWatch Logs.
- Configured the CloudWatch Agent to collect and send system logs securely to AWS.
- Developed a Python operations monitor to check CPU, memory, disk, Docker container status, and application availability.
- Added health checks and automated reports to provide a quick view of overall system status.
- Configured scheduled execution of monitoring tasks using systemd.
- Use Netdata for detailed real-time visibility into server performance, processes, networking, and disk activity.
Python Operations Dashboard
I built a custom Python monitoring application to provide a lightweight operational view of the home lab. The dashboard summarizes the information I care about most during routine checks.
Custom Python operations dashboard showing system utilization, Docker status, monitored containers, and service health.
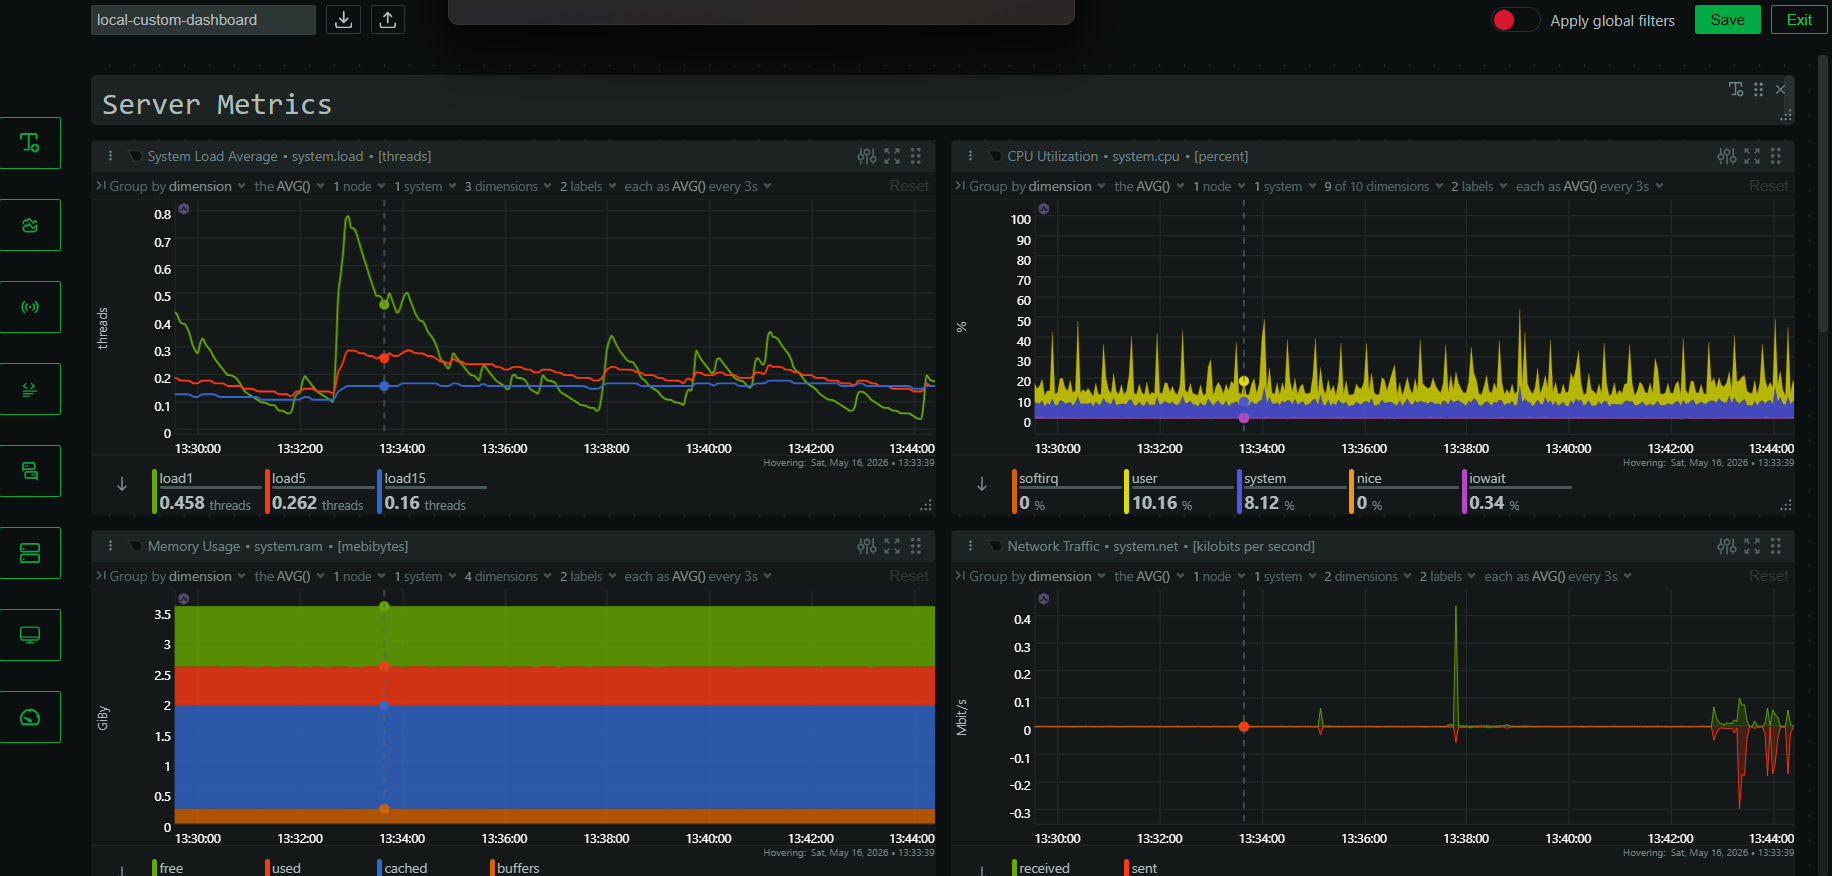
Netdata Real-Time Monitoring
While my Python dashboard provides a quick operational summary, Netdata gives me deeper visibility into system performance and helps with troubleshooting when I need more detailed metrics.
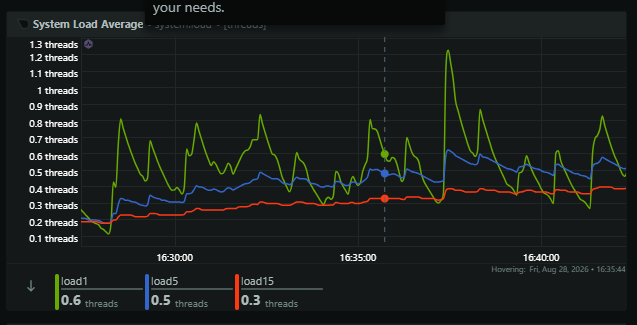
Netdata provides detailed real-time monitoring of system performance, resource utilization, processes, network activity, and disk I/O.
AWS Integration
The lab is also connected to my AWS environment. This allows me to practice hybrid monitoring concepts and work with centralized log collection outside of the local server.
- Installed and configured the Amazon CloudWatch Agent on Ubuntu.
- Send Linux authentication and system logs to Amazon CloudWatch Logs.
- Configured IAM permissions required for secure CloudWatch access.
- Troubleshot agent configuration, credentials, DNS, permissions, and log delivery issues.
- Review log volume, retention, and CloudWatch cost considerations.
What I've Learned
- Building a service is only the first step. Monitoring, troubleshooting, maintenance, and documentation are just as important.
- Linux permissions, DNS, routing, authentication, and container networking frequently overlap when troubleshooting system issues.
- Simple automation can remove repetitive operational checks and make infrastructure problems easier to identify.
- Centralized logging makes troubleshooting easier because system activity remains available even when I am away from the local environment.
- Running multiple services on one host requires attention to ports, dependencies, resource utilization, and security.
Current Focus
- Improving Python monitoring and automation.
- Expanding infrastructure monitoring and alerting.
- Strengthening Linux administration and troubleshooting skills.
- Continuing security hardening of the environment.
- Improving documentation and architecture diagrams.
- Expanding Docker services while keeping the environment manageable and reliable.
What's Next
My goal is to continue evolving the lab into a more production-style environment. Future improvements will focus on alerting, backup and recovery, additional automation, centralized monitoring, cloud integration, and operational practices that reflect the work performed in Cloud Operations environments.